
Alibaba Group Holding Ltd. reported mixed results for its September quarter, highlighting both opportunities and challenges within Chinaâ€

Revenue, however, grew by a modest 5% to 236.5 billion yuan, falling short of analyst expectations of 238.9 billion yuan. Alibabaâ€
Despite macroeconomic headwinds, Alibabaâ€
Alibabaâ€
Beijingâ€
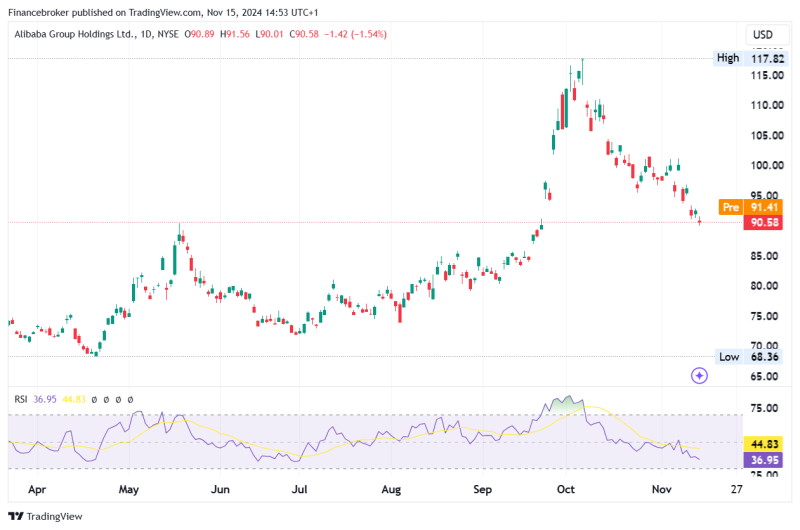
Alibaba Stock Chart Analysis
The 15-minute chart for Alibaba Group Holdings Ltd. (NYSE: BABA) stock shows recent volatility and a decline in momentum. After a sharp drop from the 95.66 level on November 7, the stock attempted to stabilize but encountered resistance around the 92 level, which has capped upside attempts. The price continued to exhibit a gradual downward trend, closing at approximately 91.61, down 0.21%.
Recent trading sessions indicate a lack of buying strength, as reflected in the failure to break through resistance levels. The chart shows multiple red candlesticks, highlighting bearish sentiment, and support is now seen near the 90 level. Should the stock breach this support, further downside pressure could be anticipated.
The pre-market price of 91.52 suggests a minor increase, but with limited momentum, especially if the broader Chinese economic concerns weigh on sentiment. The Relative Strength Index (RSI) remains low, signaling that the stock is not yet oversold but is leaning towards bearish momentum.
In the near term, traders may watch for a potential bounce near the 90.54 support or a break below it as a signal for continued bearish movement. A sustained move above 92 could offer a reversal opportunity, but overall sentiment remains cautious amid macroeconomic challenges in China.
The post Alibaba Stock Rises 5% in Premarket appeared first on FinanceBrokerage.