

Kohlâ€
In response to the challenging environment, Kohlâ€
CEO Tom Kingsbury acknowledged the struggles in key categories but highlighted growth in segments like Sephora and home decor. However, these gains were insufficient to offset the broader declines. On a positive note, gross margin improved slightly, rising 20 basis points to 39.1%, and inventory levels were reduced by 3% year-over-year.
Kohlâ€
Kohlâ€
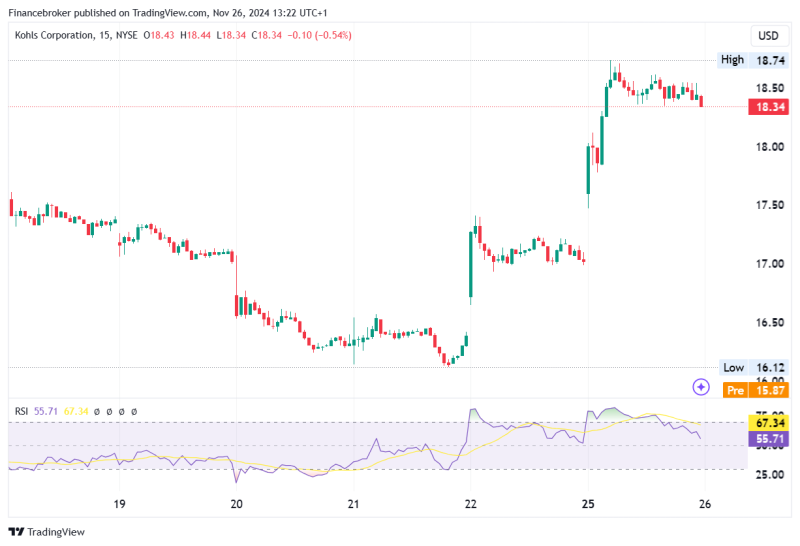
KSS/USD 15-Minute Chart
The 15-minute chart of Kohlâ€
The RSI (Relative Strength Index) initially showed oversold conditions below 30 before recovering, peaking above 70, signalling overbought territory during the recent surge. Currently, RSI is at 55.71, suggesting neutral momentum but leaning towards consolidation. The price now sits around $18.34, reflecting a slight pullback after reaching a session high of $18.74.
Resistance appears near $18.50–$18.75 as the price struggled to maintain upward momentum. Support levels can be observed around $17.00–$17.50, offering potential entry points if a retracement occurs. The recent price breakout and volume spikes suggest a bullish bias in the short term, though continued strength is contingent on holding above $18.
Traders should monitor RSI divergence and volume patterns to confirm a potential continuation of the uptrend or a reversal. A break above $18.75 could pave the way for higher highs, while failure to hold $18 may signal a correction toward key support zones.
The post Kohlâ€