
Dow Jones futures, along with S&P 500 and Nasdaq 100 futures, edged lower early Tuesday as investors remained cautious ahead of a pivotal week for the markets. Nvidia (NVDA), a key driver of the tech sector, continued its decline, shedding 4.2% Monday after a 3.2% drop on Friday. The stock is testing support at its 10-week moving average, a critical technical level.
Nvidiaâ€

Meanwhile, market participants are awaiting the release of the Federal Reserveâ€
With uncertainty looming, traders should remain vigilant, focusing on key technical levels and macroeconomic data to guide investment decisions.
Nvidia Stock Chart Analysis
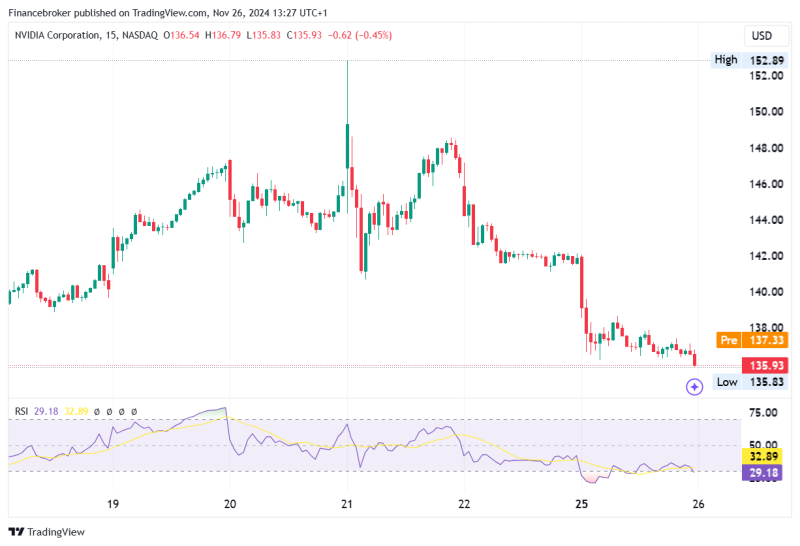
NVDA/USD 15-Minute Chart
The 15-minute chart of NVIDIA Corporation (NASDAQ: NVDA) shows a steady downtrend over recent sessions, with the stock declining from its high near $152.89 to its current level at $135.93. The price action indicates persistent selling pressure, as lower highs and lower lows dominate the chart. The sharp drop around November 24 suggests increased bearish momentum, likely driven by negative sentiment or external factors impacting the broader semiconductor industry.
The RSI (Relative Strength Index) is currently at 29.18, indicating that the stock is in oversold territory. This suggests that a short-term bounce could occur, though the overall trend remains weak. The failed attempts to hold support levels near $138 and $140 further highlight the bearish outlook.
Key support is now around $135.50, as this aligns with the sessionâ€
Traders should watch volume patterns and RSI divergence for signs of a reversal. However, caution is warranted, as the overall trend remains bearish.
The post Nvidia Stock Slumps as Dow Futures Edge Lower appeared first on FinanceBrokerage.