


Oil and natural gas: oil retreated to an annual low
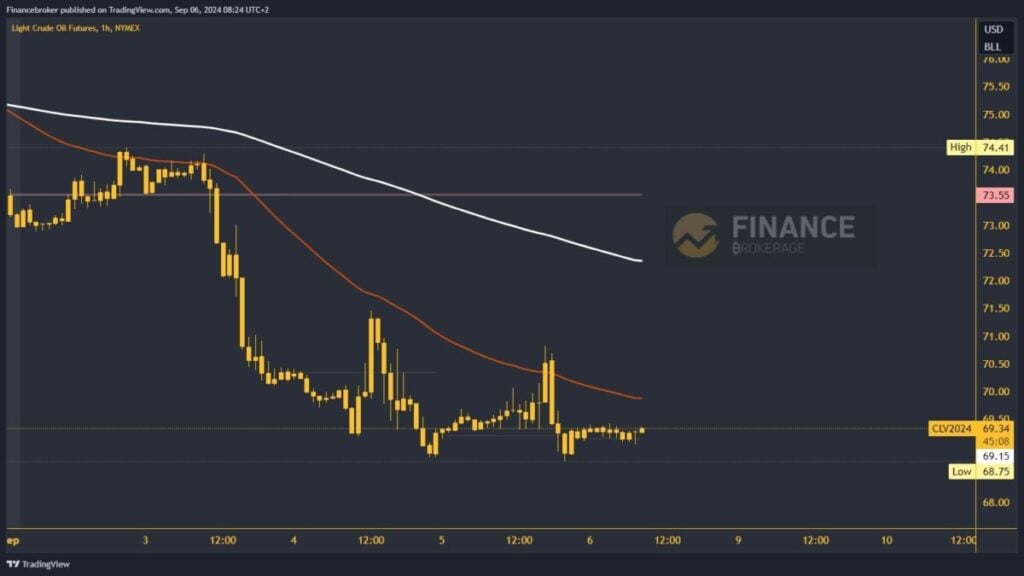
- The oil price fell to $68.75 on Thursday, a new weekly low
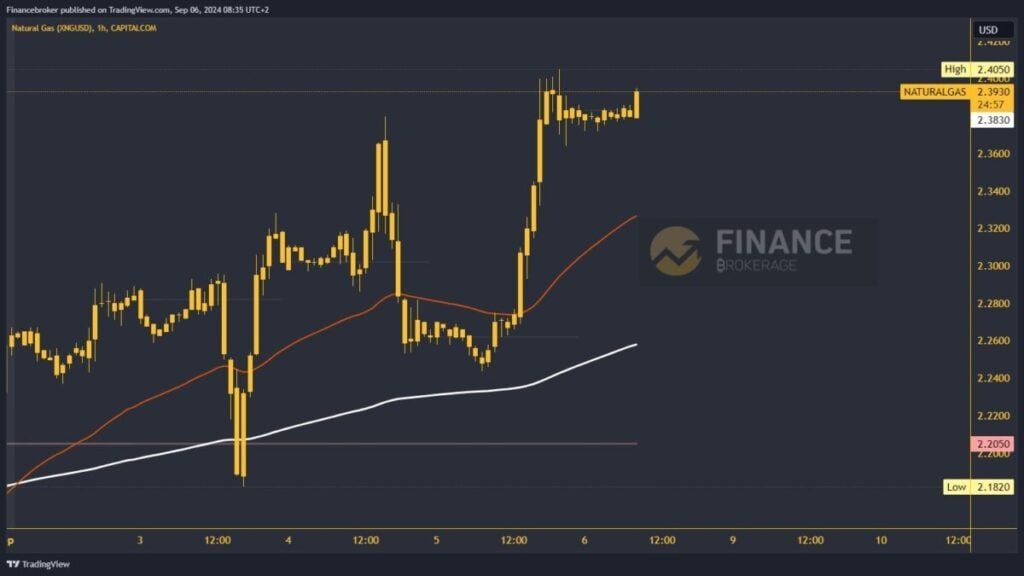
- The price of natural gas gained new support yesterday at the $2.24 level
Oil chart analysis
The oil price fell to $68.75 on Thursday, a new weekly low. By falling to this level, the lowest value of the oil price this year was formed. The previous time we were at this level was in December. During this morning’s Asian trading session, the movement took place in the $69.10-$69.40 range. The movement is quite calm, and a new impulse is waiting to start the next trend. Oil’s momentum above $70.00 will move us above the EMA 50 moving average.
With the new support, optimism about recovering to higher levels is growing. Potential higher targets are $70.50 and $71.00 levels. For a bearish option, we need a negative consolidation and a drop in the price of oil below the $69.00 level. That would bring us back to test the previous low. A new visit brings new pressure to that level, and this time, we could see an impulse below. Potential lower targets are $68.50 and $68.004 levels.
Â
Natural gas chart analysis
The price of natural gas gained new support yesterday at the $2.24 level. After that, we saw the initiation of a strong bullish consolidation all the way to $2.40, where we formed a new weekly high. During this morning’s Asian session, we saw a minor pullback, and movement took place in the $2.37-$2.39 range. The zone looks stable, and we expect to continue to grow at no more levels. Potential lower targets are the $2.42 and $2.44 levels.
For a bearish option, we need a negative consolidation and a drop below the $2.36 level. This would lower the price of natural gas to a new daily low and thus confirm the bearish presence. After that, we will see a further pullback and the creation of a new low. Potential lower targets are $2.34 and $2.32 levels. Possible support could be the EMA 50 moving average in the $2.32 zone.
Â
The post Oil and natural gas: oil retreated to an annual low appeared first on FinanceBrokerage.