


S&P 500 and Nasdaq recovering from Friday’s decline
- The S&P 500 index retreated down on Friday to 5496.2 level.
- Last week’s bearish consolidation of the Nasdaq index formed a new low at the 19467.6 level.
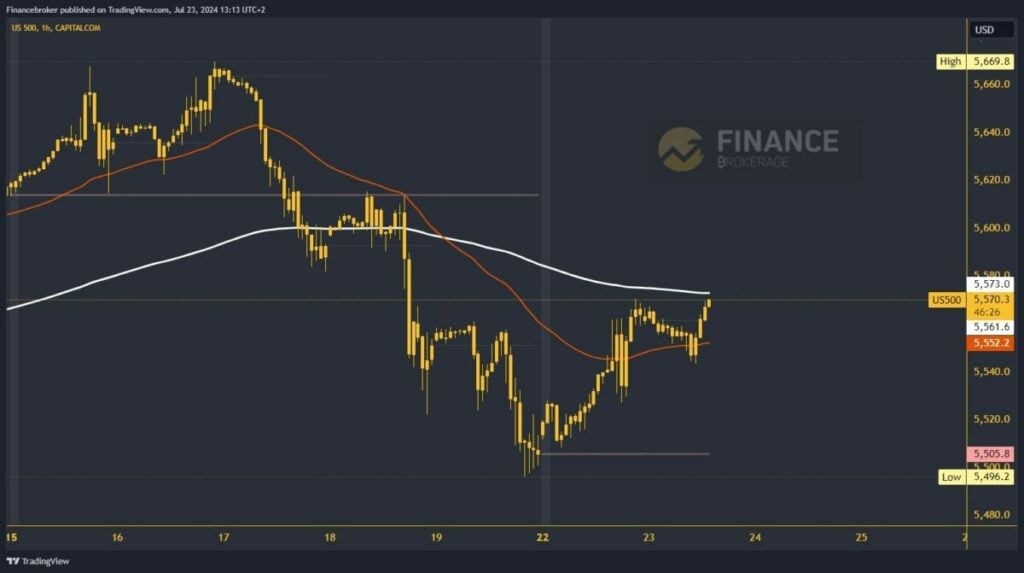
S&P 500 chart analysis
The S&P 500 index retreated down on Friday to 5496.2 level. At the start of this week, a bullish consolidation was initiated from the support zone. The index is now at 5570.0 and could soon test the EMA 200 moving average. We need momentum above to create a new weekly high. Above 5580.0, we get support from the EMA 50 moving average, and the chances of seeing further progress on the bullish side increase.
Potential higher targets are 5600.0 and 5620.0 levels. For a bearish option, the S&P 500 could initiate a bearish consolidation below the 5540.0 support this morning. In this way, we will form a new daily low and thus confirm the bearish scenario. Potential lower targets are 5520.0 and 5500.0 levels. This week, we will follow the recovery of the S&P 500 on the wings of the started bullish trend.
Â
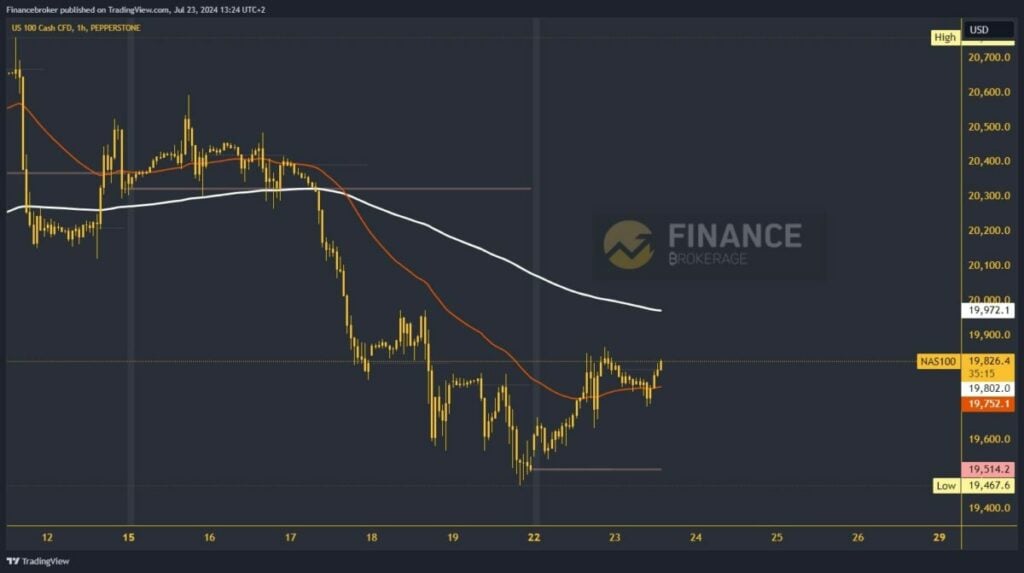
Nasdaq chart analysis
Last week’s bearish consolidation of the Nasdaq index formed a new low at the 19467.6 level. After that, we were able to stabilize there and initiate a bullish consolidation this week. During this morning’s Asian session, the index received support from the EMA 50 moving average, and we expect it to climb to a new weekly high. Potential higher targets are the 19900.0 and 20000.0 levels.
Additional resistance for Nasdaq is the EMA 200 moving average in the zone of 20000.0 level. With a jump above, there will be an intensification of bullish momentum for further recovery. For the bearish option, we need negative consolidation and descent to the 19600.0 level. With this, we break through the previous bullish formation and make a new low. After that, the index should continue to retreat under pressure. Potential lower targets are 19500.0 and 19400.0 levels.
Â
The post S&P 500 and Nasdaq recovering from Friday’s decline appeared first on FinanceBrokerage.