
The opening of a Starbucks near South Koreaâ€

While Starbucks often tailors its expansion strategies to local cultural and economic contexts, this storeâ€
From a business perspective, this venture demonstrates Starbucksâ€
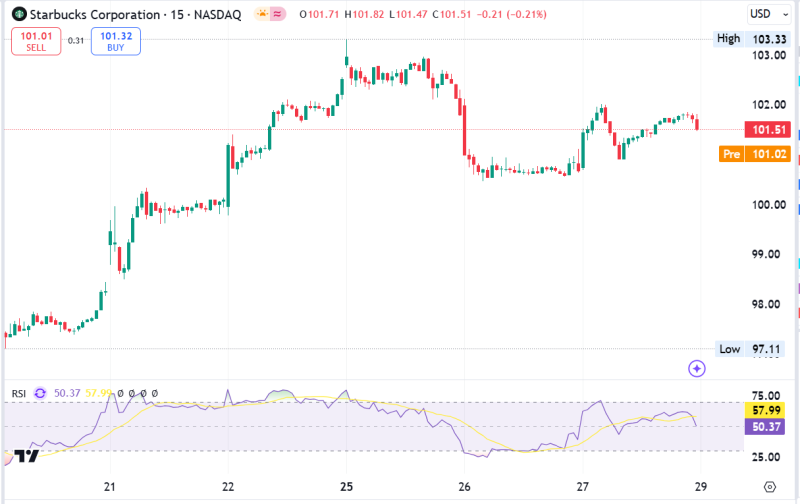
Sturbucks Stock Chart Analysis
This 15-minute chart for Starbucks Corporation (SBUX) highlights recent price action. The stock is trading at $101.51, down 0.21% for the day. The overall trend on this timeframe shows a sharp rally early in the week, followed by a pullback and consolidation.
The chart indicates a recent high of $103.33, which may act as a key resistance level. The price retreated from this level and found support near $97.11. This bounce shows potential buyer interest around the lower levels. The recovery on the 27th suggests renewed bullish momentum but is tempered by some sideways trading in the most recent sessions.
The Relative Strength Index (RSI) is at 50.37, which reflects neutral momentum. It suggests neither overbought nor oversold conditions, indicating potential indecision among market participants.
From a technical perspective, the key zones to watch include resistance at $103.33 and support at $97.11. A break above resistance could pave the way for further upside, while a drop below support might indicate renewed bearish sentiment.
Traders may look for confirmation through volume or additional indicators, as the sideways consolidation suggests a lack of strong conviction in either direction at the moment. A breakout or breakdown is likely to set the next trend.
The post Starbucks (SBUX) Stock Analysis: Key Resistance at $103.33 appeared first on FinanceBrokerage.