Nifty 50 Index – Get All The Essential Information About It
Nifty 50 Index has become, in a very short time, one of the most favorite indices for investing by many serious stock investors around the world.
As interest in this Index grew over time, it also happened that many people wanted to invest in it. However, everyone’s main question is – is it worth it? What are the predictions
To give all the important answers, let’s first clarify what kind of Index we discuss here!
What is Nifty 50 Exactly?
The NIFTY 50 represents a specific benchmark Indian stock market index. It includes the average of 50 of the largest Indian companies that have been listed on the National Stock Exchange, or simply called the “NSE Indices.� They are both the owner and the manager of it.
The NSE Strategic Investment Corporation Limited owns this subsidiary; that’s also how the NSE indices have been described. The Nifty 50 index represents 59% of the free float market in stocks. These stocks have been listed on the NSE as of September 29, 2023.
In the six months leading up to September 2023, the Nifty 50 index accounted for about 34.6% of the total trading value. This value represents all stocks traded on the NSE.
Since June 26, 2009, the Nifty 50 index has used the Free Float Market for its calculations.
Nifty 50 Index: Methodology
The NIFTY 50 index refers to a special kind of market capitalisation-weighted Index based on free float. To be included in the Index, stocks need to meet the following criteria:
- They should have included an average impact cost of 0.50% or less over the past six months for 90% of observations. The basket size should be ₹100 million.
- The company must list for at least 6 months.
- Eligible companies are only those that can trade in the Futures & Options (F&O) segment.
- It should have a minimum listing history of one month by the cutoff date.
Originally, the Index utilised a full market capitalisation method. However, since June 26, 2009, it has used a free-float method.Â
The Base Date for the Nifty 50 Index
The base date for the NIFTY 50 index is November 3, 1995, marking the first anniversary of the equity market segment on the NSE. The Index was established with an apparent value of 1000 and a base capital of ₹2.06 trillion.
The Index is rebalanced twice a year, on January 31 and July 31, using average data. The NIFTY 50 index itself was introduced on November 3, 1995. This date in particular highlights exactly one year since the equity market on the NSE started observing stocks more closely and precisely than it had over the previous six months.
This process is very beneficial, since it assist investors to keep their diversified portfolio, which includes sectors such as Information technology and Financial services.
And it also includes indices such as the Nifty Bank. If any particular changes happen, fund managers, investors in the Nifty 50 and actively managed funds would get a 4-week notice. In this way, they are preserved any unpleasant surprises which prepares them for adjustments on time.
Derivatives
The NSE and NSE International Exchange (NSEIX) provide trading opportunities for futures and options on the NIFTY 50. There are two options that NSE offers to its investors: weekly and monthly expiration options.Â
This Index is the second most actively traded index option globally, following Nifty Bank. International investors can access the NIFTY 50 through GIFT NIFTY. Previously known as SGX Nifty and traded on the Singapore Exchange, it was rebranded to GIFT Nifty on July 3, 2023.Â
Its trading platform transitioned to the NSE International Exchange (NSEIX) in GIFT City, Gandhinagar. The CEO of NSEIX described this as a major milestone, highlighting the reintroduction of an international contract to India that had been previously exported.
NIFTY Next 50
For those interested in Indian markets and investment funds, it’s important to note that the NIFTY Next 50, also referred to as NIFTY Junior, includes 50 companies with free-float market capitalisations.
They are all ranking just below those in the NIFTY 50. The NIFTY Next 50 includes potential future additions to the NIFTY 50 index.
Nifty 50 TradingÂ
To start investing in Nifty 50, you should be aware of the following statistics to know whether it’s a good buy or sell option and the timing:
Current Market Price:
- 25,159.35 INR (−120.50 INR, −0.48%)
- As of Today at 11:00 UTC+2
Performance Metrics:
- 1 Day: −0.49%
- 5 Days: +0.48%
- 1 Month: +3.51%
- 6 Months: +11.78%
- Year to Date: +15.78%
- 1 Year: +28.58%
- 5 Years: +133.14%
- All Time: +8,920%
Key Data Points:
- Volume: 190.12 M
- Previous Close: 25,279.85 INR
- Open: 25,089.95 INR
- Day’s Range: 25,083.80 — 25,192.45 INR
Nifty 50 Technical Analysis
The Nifty 50 index, at the moment, is known to be in a strong sell zone. It also includes multiple technical indicators that are indicating a sell signal, such as the following ones:Â
- RSI
- STOCH
- MACD
- ADX
- CCI
- Highs/Lows
- Bull/Bear Power indicators.Â
The moving averages stay as neutral as possible. Once we get to observe them, we are witnessing exact 6 buy and 6 sell signals across the various timeframes. The oscilate points in this case are telling us that these support levels stand at the 25105.76.Â
On the other hand, we’ve got resistance levels that are currently at a 25162.43 level. They are indicating potential areas for price movement.

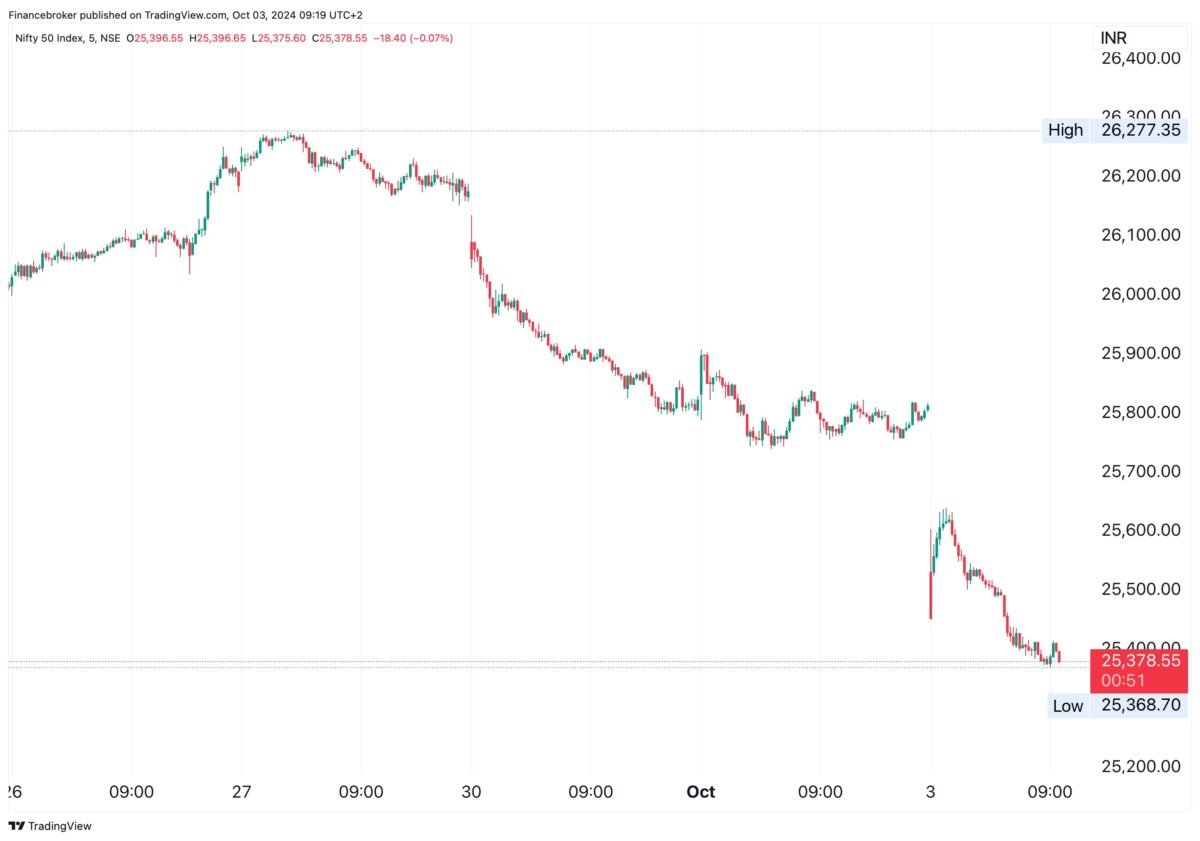
NIFTY/USD 5-Day Chart
Which Nifty 50 Index Fund is Best?
If you’re interested in investing in Nifty 50 index funds, the first crucial thing you might wonder is: Which fund is among the best? We have prepared some of the top picks to consider before making a final decision:
- SBI Nifty Index Fund
- HDFC Index FundÂ
- UTI Nifty Index Fund
- ICICI Prudential Nifty Next 50 Index Fund
What to Focus on When Making Investment Decisions?
Remember, when you’re making investment decisions, it is crucial to focus on the following important things:
- Expense ratios
- Tracking error
- Fund house reputation.Â
These funds track the Nifty 50 index, exposing you to top large-cap stocks in India.
How to Start Investing in Nifty 50?
If you’re excited to invest in Nifty 50 ETFs, such as numerous traders and investors are, we have prepared you a simple guide to get you started:
- Open your personal trading Account: First step is to choose a reliable broker that offers Nifty 50 ETFs and set up your accounts with them. Please check out our brokers list if you looking for a trustworthy and reliable broker.
- Fund Your Account: Transfer the amount you’re ready to invest into your Demat account using online banking.
- Invest in Nifty 50 ETFs: After your accounts are set up and funded, choose your preferred ETF and set up a Systematic Investment Plan (SIP) with your broker. Decide how much, how often, and for how long you want to invest.
Final Thoughts – Is It Worth Investing in Nifty 50?
One of the main thing that each and every investor worries about is – is investing in the Nifty 50 index worth it? According to our expert, investing in it lets you put money into the top 50 companies across different sectors.Â
In this way, every investors may be on its own way to build wealth over time. As we are discussing a key index for Indian stocks, it is no wonder that it shows how leading large-cap stocks are performing.Â
For a hassle-free, low-cost investment, we advise you to consider index mutual funds. They offer an easy way to invest in this diverse and high-quality index.
The post The Nifty 50 Index: Key Facts and Figures To Know About appeared first on FinanceBrokerage.


