The S&P 500 and Nasdaq are driving the recovery this morning
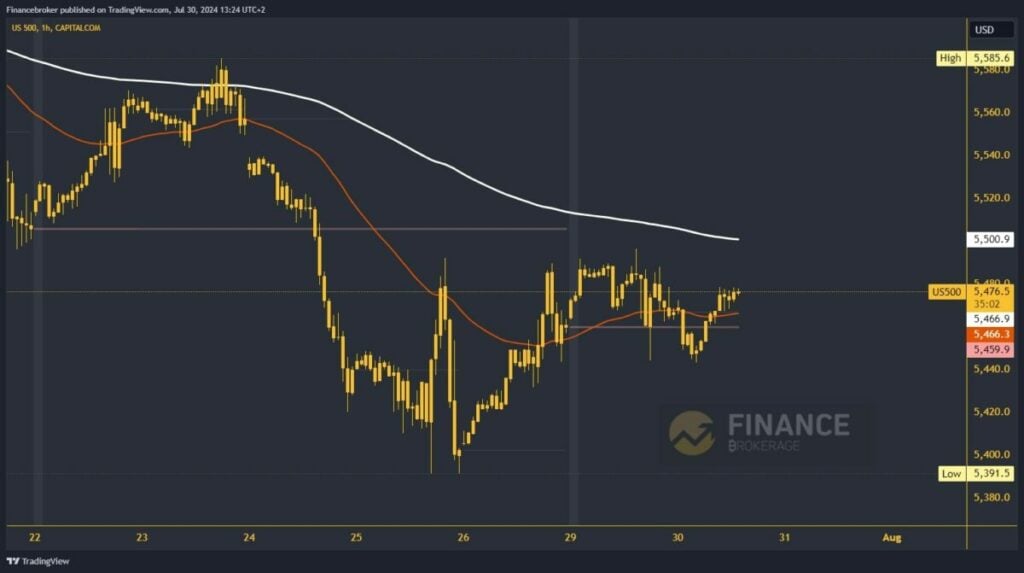
- This week, the S&P 500 index managed to stabilize in the range of 5440.0-5490.0.
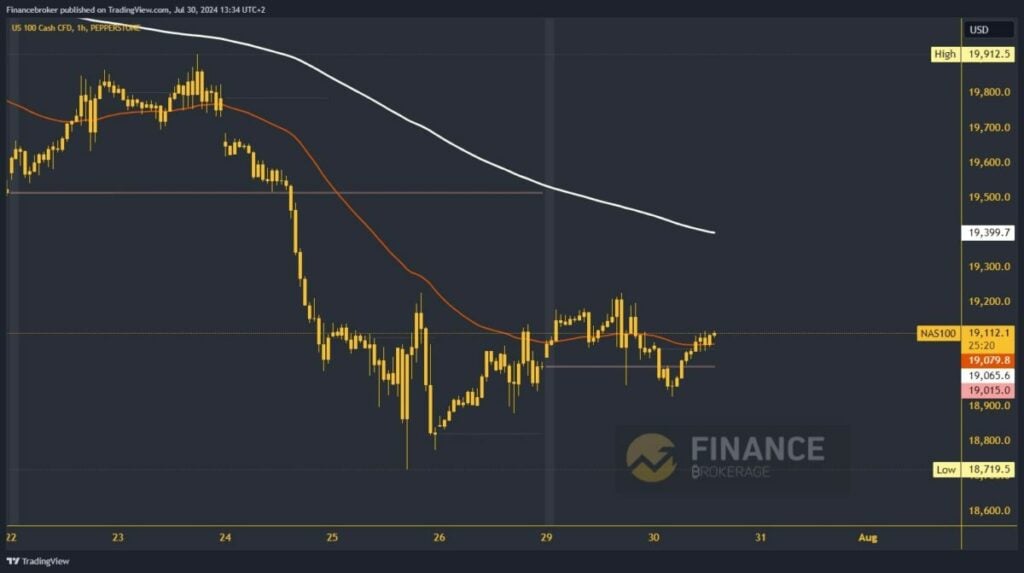
- During this morning’s Asian trading session, the Nasdaq index retreated to new support at the 18900.0 level.Â
S&P 500 chart analysis
This week, the S&P 500 index managed to stabilize in the range of 5440.0-5490.0. Yesterday, we had a new visit to the 5440.0 support level. After that, a bullish consolidation was initiated, and we are on our way to the upper line of this range. If this consolidation continues, the index could recover to the 5500.0 level. There, we will test the EMA 200 moving average in the hope that we will have the strength to continue above.
Looking ahead, potential higher targets for the S&P 500 index are the 5520.0 and 5540.0 levels. However, a bearish option is also plausible, which would require a downside consolidation and a further decline in the index to this week’s support level. This scenario would increase the pressure on the index to continue its retreat, with potential lower targets at 5420.0 and 5400.0 levels.

Â
Nasdaq chart analysis
During this morning’s Asian trading session, the Nasdaq index retreated to new support at the 18900.0 level. After that, we saw the initiation of a bullish consolidation up to the 19100.0 level. Here, we find support from the EMA 50 moving average, and we expect to start a further recovery to the bullish side. Potential higher targets are the 19200.0 and 19300.0 levels.
For a bearish option, we need a negative consolidation and a return below the weekly open price of 19000.0. With that step, we are moving to the bearish side and will be under stronger pressure that could push us into a further retreat. By falling below the 18900.0 level, the Nasdaq would descend to a new weekly low and confirm its weakness. Potential lower targets are the 18800.0 and 18700.0 levels.

Â
The post The S&P 500 and Nasdaq are driving the recovery appeared first on FinanceBrokerage.


