


The post Could a 500% Rally Return if SUI Price Holds Its Long-Term Support? appeared first on Coinpedia Fintech News
The SUI price is testing a major long-term support zone after a steep decline this year, despite many network growth metrics being affected. However, some metric still signals a contrasting trend, which could help SUI reclaim its lost throne. With total accounts rising over 900% YTD, the SUI crypto ecosystem shows strong underlying activity. This divergence creates a tense setup for traders evaluating the next phase of the SUI price chart.
SUI Price Tracks 900% Surge in Network Accounts Despite Market Weakness
One of the most surprising developments this year is the dramatic rise in total accounts on the Sui network. According to recent on-chain data, accounts surged from 26 million to 230 million YTD this marking more than 900% growth. Such acceleration highlights user activity continuing to expand even as price trends weaken.
Yet, the SUI price today tells a very different story. After hitting a high of $5.37 in January 2025, SUI collapsed more than 70%, creating a sharp disconnect between adoption and valuation. This decline also contributed to a significant weekly breakdown from a large symmetrical triangle pattern that had formed earlier in the year.
SUI Price Weakens as TVL and Stablecoin Market Cap Decline Sharply
The price drop in Q4 triggered notable damage across Sui’s DeFi landscape. Total Value Locked (TVL) fell from $2.63 billion to $947.25 million, marking a substantial contraction. Likewise, stablecoin market cap on the network dropped from $1.186 billion to $657.16 million, underscoring the deeper impact of market weakness.
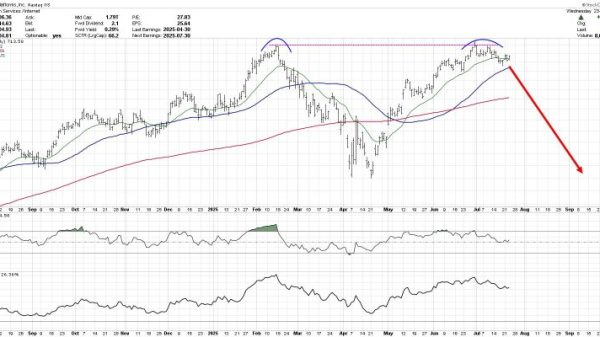
These declines reflect how strongly the price correction affected Sui ecosystem liquidity. Still, the SUI price USD currently trades at $1.37, positioning itself right at a long-term ascending trendline that has historically initiated massive reversals.
SUI Price Reaches Long-Term Trendline with Historical Rebound Potential
While the recent losses are steep, the retest of the ascending trendline is one of the most important technical events for Sui this year. In past cycles, this same trendline produced 450% and 750% rallies. Using a conservative midpoint, analysts estimate that a 500% upside could follow if this structure holds.
A breakout of this magnitude would push the SUI price toward its previous all-time high at $5.37 and potentially extend toward the $8.50 region. However, such a move depends heavily on the trendline holding through December 2025, setting up 2026 as a possible recovery phase.
On the contrary, if support holds, SUI may ignite a reversal in early 2026, while a breakdown could expose the $0.60 zone.